Micro lubrication (MQL) processing involves the application of a small amount of lubricant during processing in an attempt to replace the traditional flood coolant system. Understanding the correlation between fluid performance and MQL performance can help select lubricants from a variety of options without extensive processing testing. This study compared the physical properties, wettability, tribological properties (lubricity and extreme pressure (EP) properties), fog properties and machinability of nine different MQL fluids to determine the correlation between the measured properties and MQL drilling and reaming properties. The results show that low fluid viscosity, high fog concentration, large droplet diameter and high wettability are most related to good processability. Although it is difficult to have a strong relationship, under mild cutting conditions, the best processing of low viscosity fluid may also have the highest fog concentration, the largest titre and the best wettability.
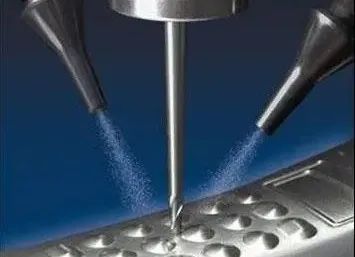
Various micro lubrication (MQL) lubricants have very different properties (each supplier creates its own formula). Understanding the fluid properties and micro lubrication (MQL) properties can help to select lubricants for micro lubrication (MQL) processing in the future without extensive processing tests. Therefore, the purpose of this study is to test commercial micro lube (MQL) lubricants in an attempt to determine which properties or bench tests are important to predict the processability of these fluids. Evaluation includes checking thermal conductivity, wettability, lubricity, extreme pressure (EP) performance, and fog characteristics. Then, these results are compared with the power consumption, surface roughness and hole diameter when machining the transmission valve body to determine whether these tests can be used as prediction indicators of actual machining performance. Microlube (Mql) Lubricants and Evaluation Methods Nine micro lubrication (MQL) lubricant test samples, named A to I, were obtained from six suppliers, and their known physical properties are listed in Table 1. The viscosity (8.8 to 69cSt) and flash point (182 to 280C) of the lubricant have a wide range. Lubricant E is the same as lubricant D, except that sulfurized EP is added. Table 1 Tested MQL lubricating oils (sorted in ascending order of viscosity) 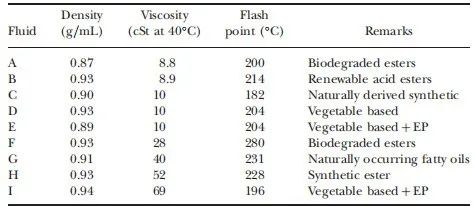
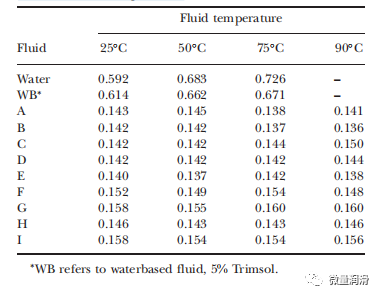
Experimental setup and results Physical properties - thermal conductivity In micro lubrication (MQL) processing, the heat generated is the same as that in traditional processing, but the fluid that can take away the heat is much less. Therefore, the thermal characteristics of a fluid can be an indicator of its heat removal capacity. In order to consider the influence of temperature on MQL lubricant, the thermal conductivity was measured at 25, 50, 75 and 90C using the thermal performance analyzer KD2Pro (ThermoTest, Texas). A water-based liquid, Trimsol (marked WB in all tests), was also tested at a concentration of 5% to compare with a trace lubricant (MQL) lubricant. Each lubricant sample is measured in a thermal isolation box with temperature control to ensure the reliability of the results. Three measurements were made for each case, and it was found that the change was less than 0.003W=m-K. The results in Table 2 show that the thermal conductivity of micro lubrication (MQL) lubricant (A-I) is much lower than that of water or water-based fluid. This means that the effective heat removal rate of MQL fluid is lower than that of traditional water-based fluid. Poor thermal removal will lead to thermal damage to the workpiece and tool during processing. In addition, in the measurement range of 25~90C, the thermal conductivity of micro lubricating (MQL) lubricant is not affected by temperature, while the thermal conductivity of water and water-based fluid increases with temperature. The thermal conductivity ranges from 0.138 to 0.160W=m-K, and tends to increase with the increase of fluid viscosity. Table 2 Thermal Conductivity of Microlube (MQL) Lubricant at Different Fluid Temperatures (W=m-K)
Bench test Wettability Wettability is a term used to describe the ability of fluids to diffuse, penetrate, and cover tools and workpieces (Sillman, 1992). The wettability of a fluid is defined as the thermal equilibrium between a droplet and the solid surface and the contact angle with the gas phase. The smaller the contact angle, the higher the wettability of the fluid. As shown in Figure 1, contact angle θ The Young equation of is:  S, L and G represent solid, liquid and gas respectively, and ⋎ is the interface tension vector. The liquid drop measurement system developed by KRU (KRU ¨ SS, Germany) is adopted to measure DAS10 with the fixed liquid drop method. Image the droplet (as shown in Figure 1), and the computer automatically fits the profile of the droplet and calculates the contact angle. The contact angles were measured on polished aluminum (Al) 6061 and tungsten carbide (WC) surfaces to simulate aluminum based workpiece materials and tool materials. The sample surface was washed with ethanol and dried between tests. The three measurements in each case are averaged, as shown in Figure 2. The contact angle of micro lubrication (MQL) lubricant is smaller than that of water and water-based fluid, which means that micro lubrication (MQL) lubricant can more thoroughly wet the surface, which means that micro lubrication (MQL) lubricant has better wettability. The contact angle between all micro lubricating (MQL) lubricants is 8.0~20.6 on aluminum and 7.6~26.5 on WC. Since wettability is usually directly related to the surface tension (cLG) of the fluid, the surface tension is measured using a surface tensiometer (Model 21, Fisher Scientific). Water and acetone were tested to ensure measurement accuracy. The results are shown in Table 3. The measured surface tensions (⋎ LG) are similar. Therefore, the difference in contact angle between fluids may be due to their different interfacial tensions (⋎ SL) with solid surfaces, because ⋎ SG is always the same in the equation (1). In addition, the research results also show that micro lubrication (MQL) lubricants are generally more effective than WC in wetting aluminum, which is also related to ⋎ SL generated by different contact surfaces. Lubricity Tapping test is a standard screening method to evaluate the cutting performance of lubricants (Zimmermanet al., 2003). A self tapping torque machine (Michigan, USA) was used in this study. The workpiece is a pre drilled 6061 aluminum plate. The pre drilled holes are filled with lubricant and then tapped with M8 tool steel rotating at 1200rpm. Torque data is recorded during tapping. The average value of the platform area is used to represent the torque generated in a particular fluid.
 Since the differences between fluids are usually small, six holes were taken for each micro lube (MQL) lubricant to improve the analysis. In addition, to ensure data comparability, liquid B was tested before and after each test sample, as shown in Figure 4. The measured torque of the measured fluid is normalized by the torque of fluid B, which is distributed as a relative tapping torque of 100. As can be seen in Figure 5, the lubricity of water-based fluid is worse than MQL lubricant (higher torque). The error bar represents a standard deviation from the average. The maximum difference for all test MQL fluids is 12% (test fluids A and I). Resolution S is used to evaluate the sensitivity of test results (Zimmermanet al., 2003),

Among them, σ 2between fluids provides an estimate of changes between fluids, while σ 2within fluid estimates the average variance of the platform for a single fluid. The high resolution of 33 measured here shows that the variation between fluids is significantly greater than that within a single fluid. Table 3 Surface Tension Results of Microlube (MQL) Lubricant:
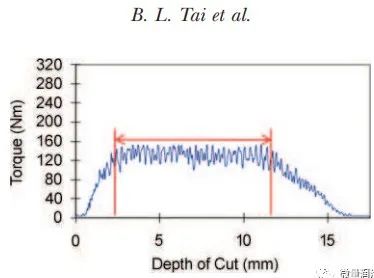
Figure 3 Example of measurement data in tapping torque test (color version of the figure can be provided online)
Fig. 4 Test procedure for tapping torque evaluation on micro lubrication (MQL) lubricant (the figure is available in color online)
Fig. 5 Normalized tapping torque efficiency of selected micro lubrication (MQL) lubricant (higher value indicates poorer lubricity)
Extreme pressure characteristics EP test is used to evaluate the performance of lubricant under extreme processing conditions. In this study, the Falex needle block machine (Fig. 6) was used for EP test (ASTMD3233). A steel pin rotates between the two steel vee blocks and applies an increased load to force the vee blocks together. The load is increased in 1.11kN (250 lb) increments to a maximum of 17.8kN (4000 lb). When the maximum load is reached, when the needle breaks, or when the worn needle stops contacting the vee block, the torque starts to drop, the test is ended. In general, fluids with better EP performance can withstand higher loads before the pin breaks. The results of all test oils are shown in Figure 7, expressed in terms of maximum load. The MQL lubricant tested has a wide range of EP properties. Trimsol containing chlorinated paraffin, as a water-based liquid as Ep Additive, also has good EP performance. Fluid E has EP additive, which has better EP performance than fluid D.
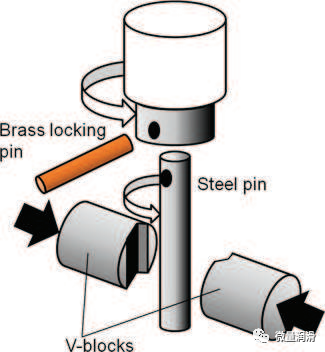
Figure 6 Test configuration of pin end block (color version can be provided online)
Fig. 7 EP Test Results of Needle and Venous Block of Selected Microlube (MQL) Lubricant (Higher value means better EP performance)
Characteristics of fog Microlube (MQL) lubricants produce oil mist applied to the processing process by mixing air with a small amount of lubricant. Therefore, understanding the relationship between lubricant and generated fog is helpful to optimize the processing process. The mist is generated by the micro lubrication (MQL) system and enters the machine housing at a flow rate of 40ml=h through the WC reamer rotating at 6000 rpm. The enclosure air is continuously discharged to the fog controller through pipes. Then, use the Microporous Uniform Deposition Impactor (MOUDI) from MSP (Minnesota Coast Review) to sample part of the air and fog in the piping system to measure the size and concentration of the fog particles. The schematic diagram of the experimental device is shown in Figure 8.
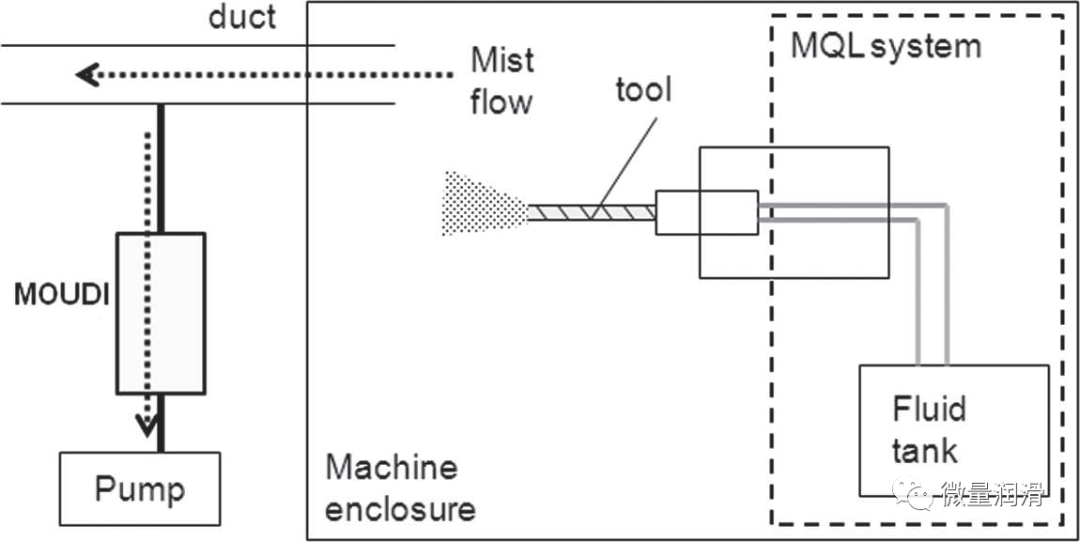
Fig. 8 Experimental setup of fog characterization MOUDI test.
The air is sampled for 30min at the air flow rate of 30L=min through the MOUDI. The MOUDI consists of 10 impactor stages with a cutting size of 18-0.056mm to capture the corresponding mist size. Before and after the test, the filters at each stage are weighed to determine the particle mass within each size range. According to the processed data, the air median aerodynamic diameter (MMAD) and the concentration of oil droplets in the air sample can be calculated. MMAD is the calculated aerodynamic model diameter, representing the midpoint of particle mass, that is, half of the particle mass is on the larger particles, and half is on the smaller particles. The fog measurement results are listed in Table 4, where rg represents the geometric standard deviation of MMAD. Fog concentration varies from 8.84 to 11.80 mg=m3, and fog MMAD varies from 2.90 to 4.07 mm. MMAD is slightly smaller than commonly observed, usually 5 to 10 mm (Dasch and Kurgin, 2010). It can also be seen from Table 4 that MQL lubricant with low viscosity produces droplets with relatively high fog concentration and MMAD value. Processing test In order to compare the performance of lubricating oils under actual processing conditions, we tested the two processing processes using the Bilomatic MQL system. In this dual channel MQL system, air and fluid are transported through the spindle respectively, then mixed at the inlet of the tool rack to form a mist, and then sprayed through the tool. To avoid contamination from different fluids, the system is always cleaned at a high flow rate for 15 minutes before testing. The oil flow rate was also calibrated to ensure comparability between tests. Since the system was designed specifically for MQL lubricant, an oil-based fluid, no water-based fluid was used for comparison in processing tests. The conditions used for each test are shown in Table 5. These two processes include: Drill three sliding holes on the cast 393 aluminum alloy transmission valve body. Use a PCD reamer to articulate the same three valve holes on the valve body. The pre drilled holes in the valve body remove relatively little material. These parts are processed on the EnshuJE50S CNC machine tool, and the maximum spindle speed is 12000 RPM. The test tool is from Komet1 (Fort Somme, Illinois). Coarse drill is a double groove carbon step drill, highly polished to improve lubrication. The reamer has 8 PCD inserts, 4 inserts per diameter. Spindle power was measured for all tests. A single spectral unit is installed on the spindle, which records the DC current reading and converts it into voltage reading. The voltage data is converted to power by a calibrated factor. Table 4 Fog Concentration and MMAD of Microlube (MQL) Lubricant Table 5 Machining Test Setup 
Processing power consumption When the valve hole on the valve body is drilled first, record the processing power. Each sliding core hole has two diameters at different depths, as shown in Figure 9. Due to the complex structure of the valve body, the processing of the valve core hole produces a complex power distribution, as shown in Figure 10. In order to compare the power, we use fluid B as the reference fluid, and cover the power profile of the test fluid on the power profile of the reference fluid. The difference between the two superimposed regions is considered as the difference of total energy consumption in the processing. The positive value in Table 6 indicates the energy required for fluid B, while the negative value indicates that the test fluid is more effective than fluid B. Hole quality. After the machining test, measure the surface finish and diameter of the valve body hole to compare the performance of each fluid. Use Taylor Hobsonta lysurf (UK) profilometer to measure the surface roughness of the valve body reamed hole. The measuring length is 15mm, the cut-off length is 0.8mm, and the surface roughness Ra is calculated. The three reaming holes were measured three times respectively. The result is shown in Fig. 11, and the error bar represents a standard deviation of the average value of 9 measurements in three holes. Fig. 9 Machining Scheme for Step Drill=Reamer Valve Body Slide Valve Hole
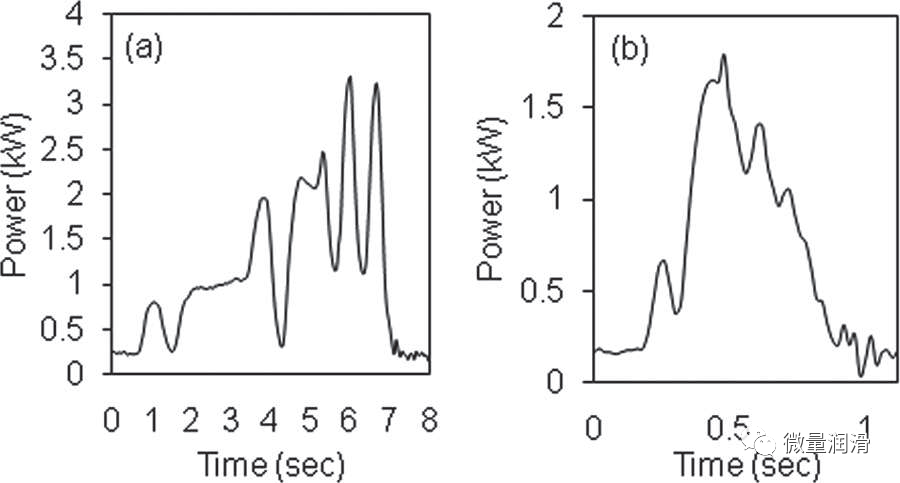
Fig. 10 Example of power distribution for machining valve body (a) bore and valve core bore (b) counterbore with fluid B
The diameter of the valve body bore is measured using an air column gauge (Intra, Westland, Michigan). Figure 12 lists the average values of the small diameter and the large diameter of the three holes on the valve body for different lubricating oils. In general, low viscosity MQL fluids produce finer surface finishes and more accurate pore sizes with high viscosity fluids. The reason may be related to their fog characteristics, which will be discussed below. Note that liquid A is an exception because its surface finish and diameter accuracy are slightly lower than liquid B-D. Table 6 Comparison of energy consumption for valve body machining with MQL lubricating oil 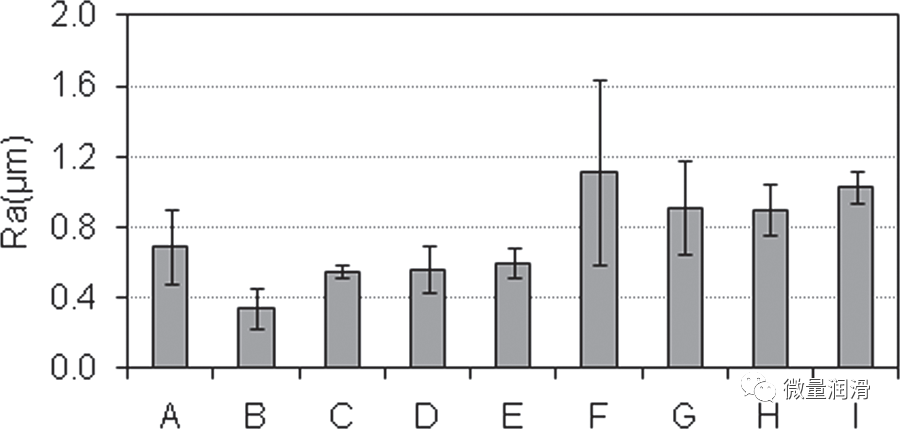
Fig. 11 Surface Roughness of Reamed Valve Hole of Valve Body
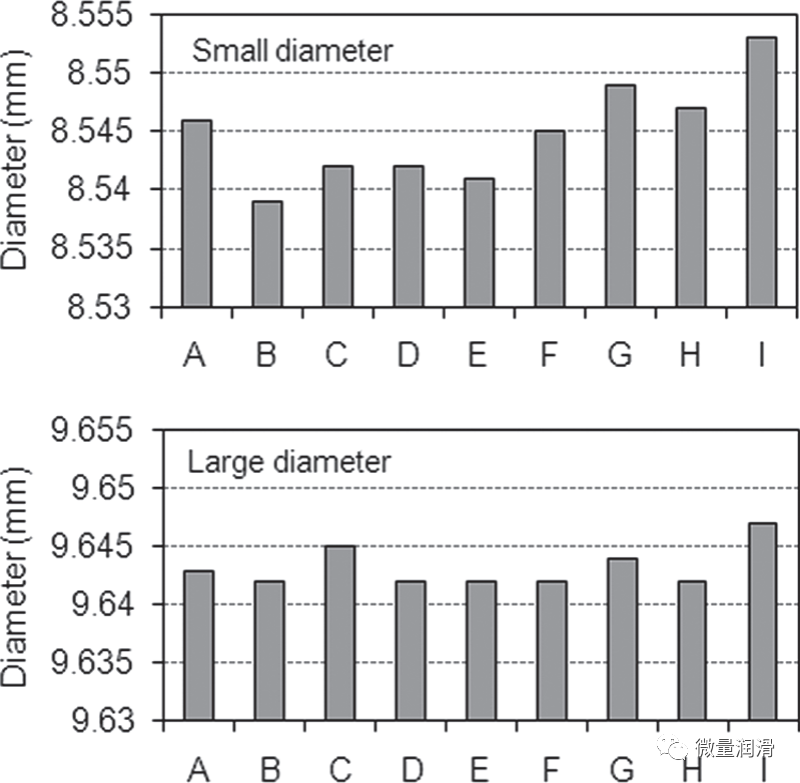
Fig. 12 Diameter of Hinged Valve Core of Valve Body (Tool Diameters are 8.531 and 9.631mm respectively)
Correlation analysis and discussion Fluids with good lubricity, wettability and thermal properties are expected to have higher processing efficiency. In order to analyze these relationships, we calculated the correlation between all tests based on the physical properties of the fluid discussed, including fluid test results and processability. The correlation coefficient (r) is calculated as follows:
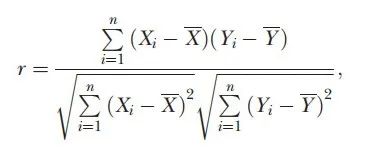
Where, X and Y are the experimental data of the two properties compared. Table 7 shows the correlation between the physical properties of the fluid and all bench tests. The bold value is a good correlation attribute at the 5% significance level (0.602 when the sample size is 9). It can be seen that low viscosity is related to high wettability (low contact angle), high fog concentration and fog diameter. The high wettability is due to the easy diffusion of low viscosity fluids on the surface. The tendency of low viscosity fluids to produce large particles is consistent with the larger particle size (lower viscosity than MQL fluids) found in water-based fluids (Dasch and Kurgin, 2010). The high fog concentration may be caused by the large particle size in the fog sample. Thermal conductivity was also found to be related to wettability and fog level, although they were theoretically independent. These correlations may be more related to viscosity, because there is a strong correlation between thermal conductivity and viscosity, which is 0.747.
Table 7 Correlation coefficient between physical properties of fluid and bench test

Table 8 shows the correlation between all bench tests and machining tests. The results show that the fog diameter (MMAD) is related to lower energy consumption, finer surface finish and more accurate diameter. High fog concentration can also improve surface finish and diameter accuracy. Since MQL processing is completed through the fog sprayed by the tool, it is reasonable that high fog concentration and fog size can create a relatively wet environment in the cutting area. As a result, better surface finish and more accurate diameter can be produced. In addition, high wettability (small contact angle) is related to diameter accuracy, which can also be interpreted as the ability to wet the cutting area. Weak correlations or uncorrelations of other tests may be true or difficult to measure in short-term and mild processing tests. In EP testing, fluids with better EP performance can be tested, which does not reflect the advantages of valve body processing, because the process is probably not under boundary lubrication conditions.
Table 8 Correlation coefficient between bench test and machining test
Table 9 Correlation coefficient between physical properties and machining test

From Table 7 and Table 8, the physical properties and processing properties are linked. As calculated in Table 9, we can conclude that low viscosity leads to high concentration of large particle fog, which can improve the processing capacity shown in energy consumption and improve surface finish and diameter accuracy. In addition, the lubricating oil with lower viscosity has better wettability, which can improve the diameter accuracy.
This study evaluated nine commercial MQL fluids and one common MWF to determine the importance of fluid properties based on their thermal conductivity, wettability, lubricity, EP performance, fog generation, and processability. Traditional MWFs are usually water-based, while MQL lubricants are usually straight oil. As shown in this study, MQL lubricating oil has poor heat removal performance compared with water-based liquid, but it improves the wettability and lubricity. In MQL lubricant, processing results show that low fluid viscosity, high fog concentration, large fog droplet diameter and high wettability are most related to good processability. The lack of correlation with EP performance may be related to the mild processing conditions used in this study, which are likely not within the boundary lubrication range. Although it is difficult to draw a relationship based on these experimental results, under these mild processing conditions, the optimal processing of low viscosity fluid conforms to high fog concentration, large droplet size and good wettability.

![]() January 26, 2023
January 26, 2023


